- Home
- Views On News
- Jul 17, 2023 - Gillette India Share Price - Is This the Best an Investor Can Get?
Gillette India Share Price - Is This the Best an Investor Can Get?
Investing in a multinational corporation (MNC) stock is often considered preferable, even if the stock price underperforms for a period of 4-5 years.
Investors tend to perceive a sense of safety when investing in MNCs, as compared to Indian companies that may face criticism during long-period underperformance in the euphoric phases of the market.
A prime example of this is Gillette India, which has struggled to perform over the past 5 years.
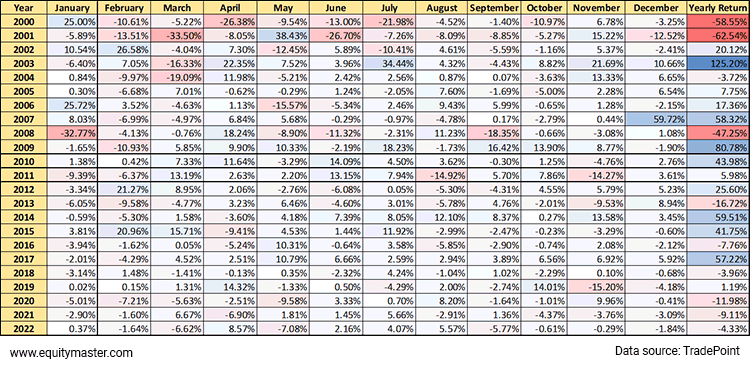
To gain further insights into the stock's performance, here is the seasonality since the year 2000.
Gillette India Seasonality Table

The performance of 2023 is till the closing of 14 July 2023.
After experiencing a remarkable rally of 57% in 2017, the stock's performance took a downturn from 2018 to 2022, with returns ranging from flat to negative. In contrast, the benchmark index made significant progress during the same period.
The stock's underperformance over these years indicates a divergence from the overall market trend and it may have left investors disappointed with their investment.
What's Next?
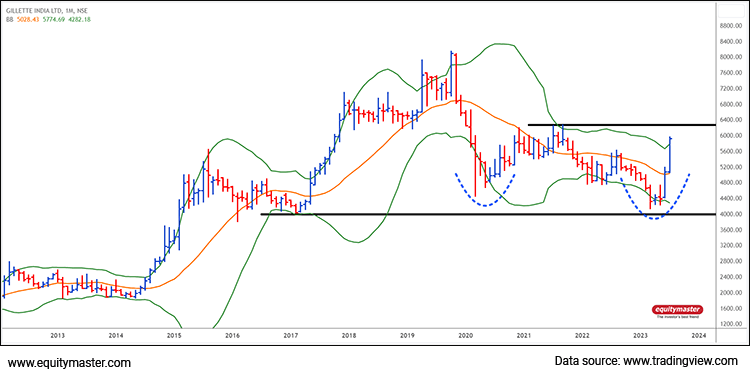
On the monthly chart, multiple chart patterns suggest potential opportunities for a positive price movement. However, it is crucial to consider the associated risks to make informed investment decisions.
Gillette India, Monthly Chart
C

Chart Patterns:
-
Double Bottom Pattern: The stock has formed a double bottom pattern on the chart, with the neckline at Rs 6,200. This pattern indicates a potential trend reversal and could signal a bullish move if the neckline is breached upwards.
-
Bollinger Bands: The stock price is currently trending above the Bollinger Band, indicating an extended price range.
Moreover, the Bollinger Bands are on the verge of expansion, suggesting the possibility of increased volatility and potential upward momentum. Traders often interpret such expansions as potential bullish signals.
-
Reversal Structure: According to Dow Theory, the breach of the swing low at Rs 4,287 has already occurred. However, the breach of the key resistance level at Rs 6,200 would mark the end of the lower-high lower-low structure, potentially indicating a bullish reversal.
This development aligns with Dow Theory principles and could attract investors looking for trend reversals.
Associated Risks
-
Failure to Cross Rs 6,200: If the stock fails to cross the critical resistance level of Rs 6,200, it could result in the failure of the double bottom pattern and cast doubt on the potential reversal.
Traders and investors should closely monitor the price action around this level to gauge the stock's strength.
-
Failure of Bollinger Band Expansion: Although the Bollinger Bands are on the verge of expanding, there is a risk of failure. If the stock fails to maintain upward momentum and the Bollinger Bands contract, it could indicate a lack of bullish strength and dampen the potential price movement.
-
Market Retracement Risk: As the broader markets are currently trending at all-time highs, there is a risk of a retracement that could impact the stock price. Traders and investors should be mindful of the overall market trend and its potential influence on the stock.
In Conclusion
Gillette India's monthly chart reflects several chart patterns, including the formation of a double bottom pattern, the potential expansion of Bollinger Bands, and the possibility of a reversal as per Dow Theory.
It is important to consider the associated risks, such as failure to breach key resistance levels and the broader market's potential retracement.
Traders and investors should carefully assess these factors and consider them in their investment strategies before making any decisions.
If you're interested in being part of my charting journey, join my telegram channel - Fast Profits Daily. You'll get access to the best trading ideas in the stock market.
Safe Stocks to Ride India's Lithium Megatrend
Lithium is the new oil. It is the key component of electric batteries.
There is a huge demand for electric batteries coming from the EV industry, large data centres, telecom companies, railways, power grid companies, and many other places.
So, in the coming years and decades, we could possibly see a sharp rally in the stocks of electric battery making companies.
If you're an investor, then you simply cannot ignore this opportunity.
Details of our SEBI Research Analyst registration are mentioned on our website - www.equitymaster.comDisclaimer: This article is for information purposes only. It is not a stock recommendation and should not be treated as such. Learn more about our recommendation services here...

Brijesh Bhatia Research Analyst and expert chartist, is the editor of Alpha Wave Profits. Fully committed to his craft, Brijesh has mastered the art of making money by trading using technical analysis. Brijesh has an MBA from ICFAI and 16 years of experience in India's financial markets. He began his career on Dalal Street as commodities dealer and it wasn't long before he developed his own unique trading system. Brijesh worked on his trading system until it could be expected to deliver 5 units of return for every unit of risk.


Equitymaster requests your view! Post a comment on "Gillette India Share Price - Is This the Best an Investor Can Get?". Click here!
Comments are moderated by Equitymaster, in accordance with the Terms of Use, and may not appear
on this article until they have been reviewed and deemed appropriate for posting.
In the meantime, you may want to share this article with your friends!